Hailey Ernest
I specialize in cleaning, transforming, organizing, analyzing, and visualizing data, turning complex datasets into clear, actionable insight through statistical modeling, machine learning, and thoughtful storytelling.

Background
About Me
Education
Coursework
Technical Skills
Work
Projects
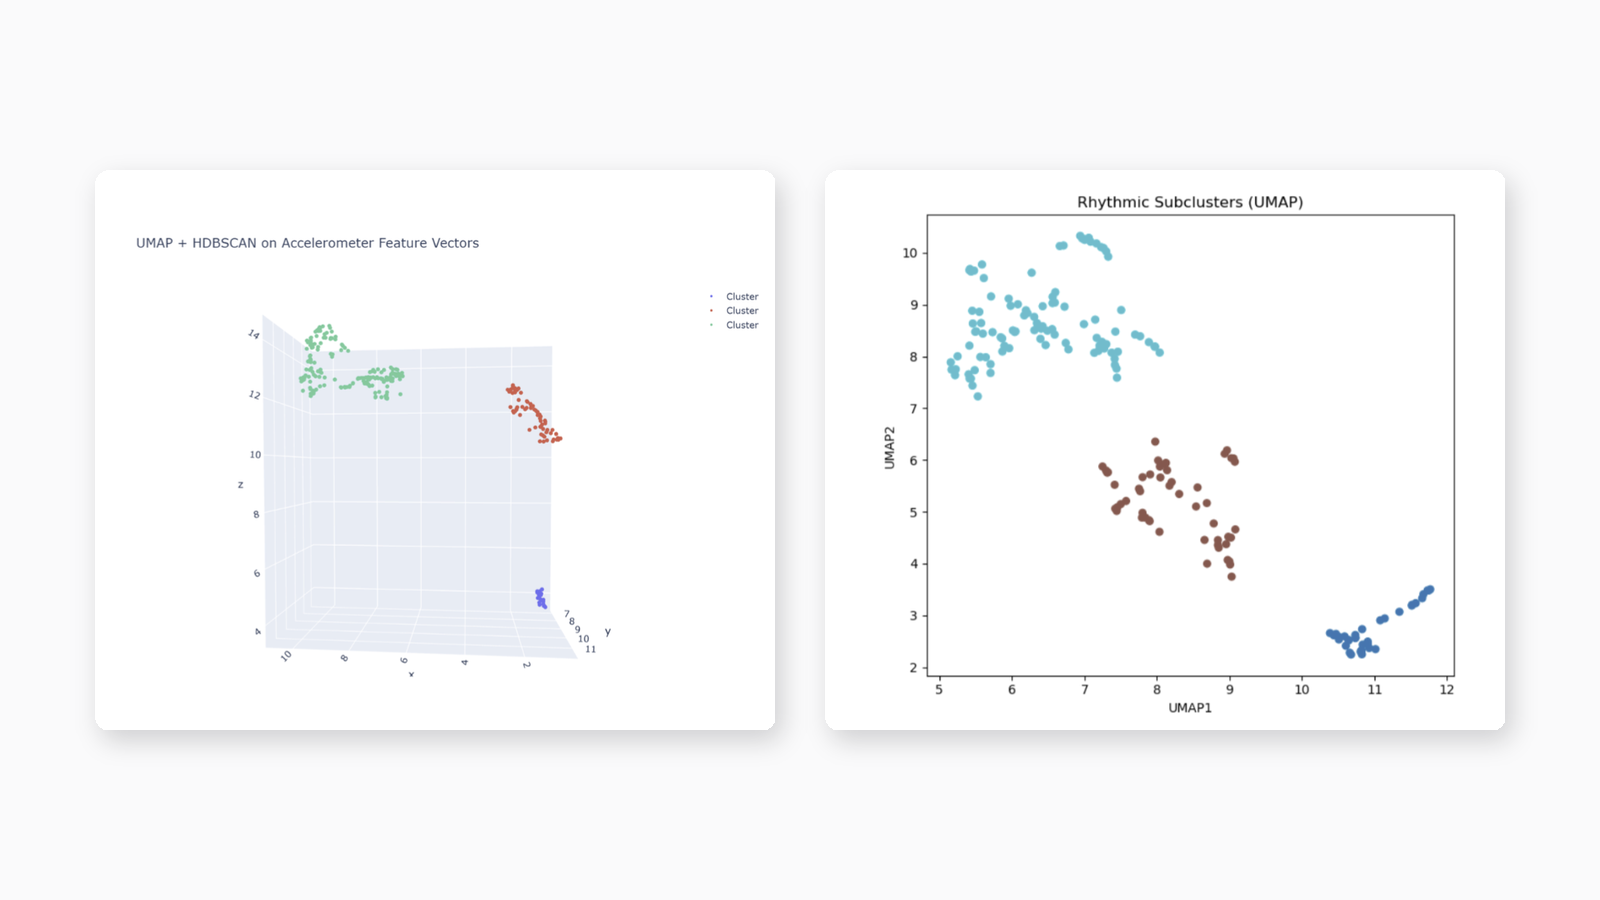
NASA Capstone: Cryogenic Boiling Detection
Classifies acoustic boiling regimes in cryogenic fuel systems using 36 engineered signal features, UMAP dimensionality reduction, and HDBSCAN. Achieves 99% clustering stability across 446 experimental runs.
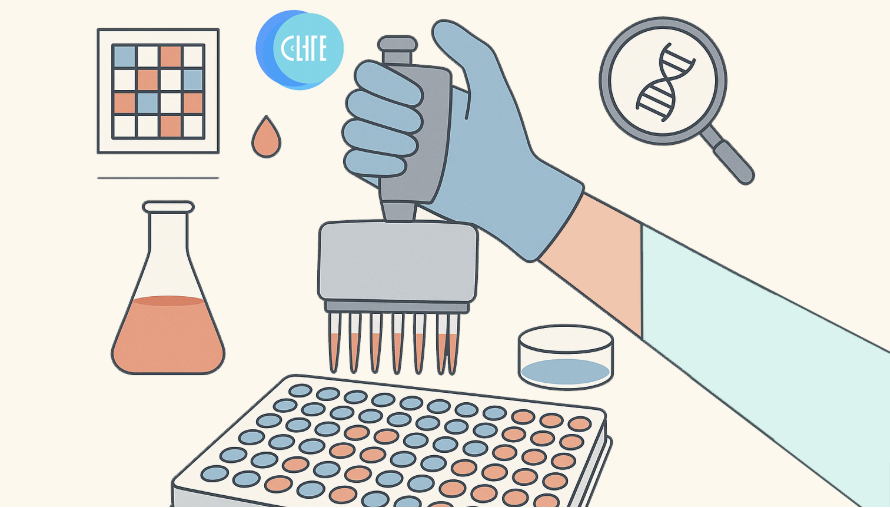
Ondine Biomedical: Data Science & Automation
Automation and analysis tools built as a Data Science Consultant at Ondine Biomedical, spanning high-throughput assay analysis, clinical trial data pipelines, and laboratory workflow automation.
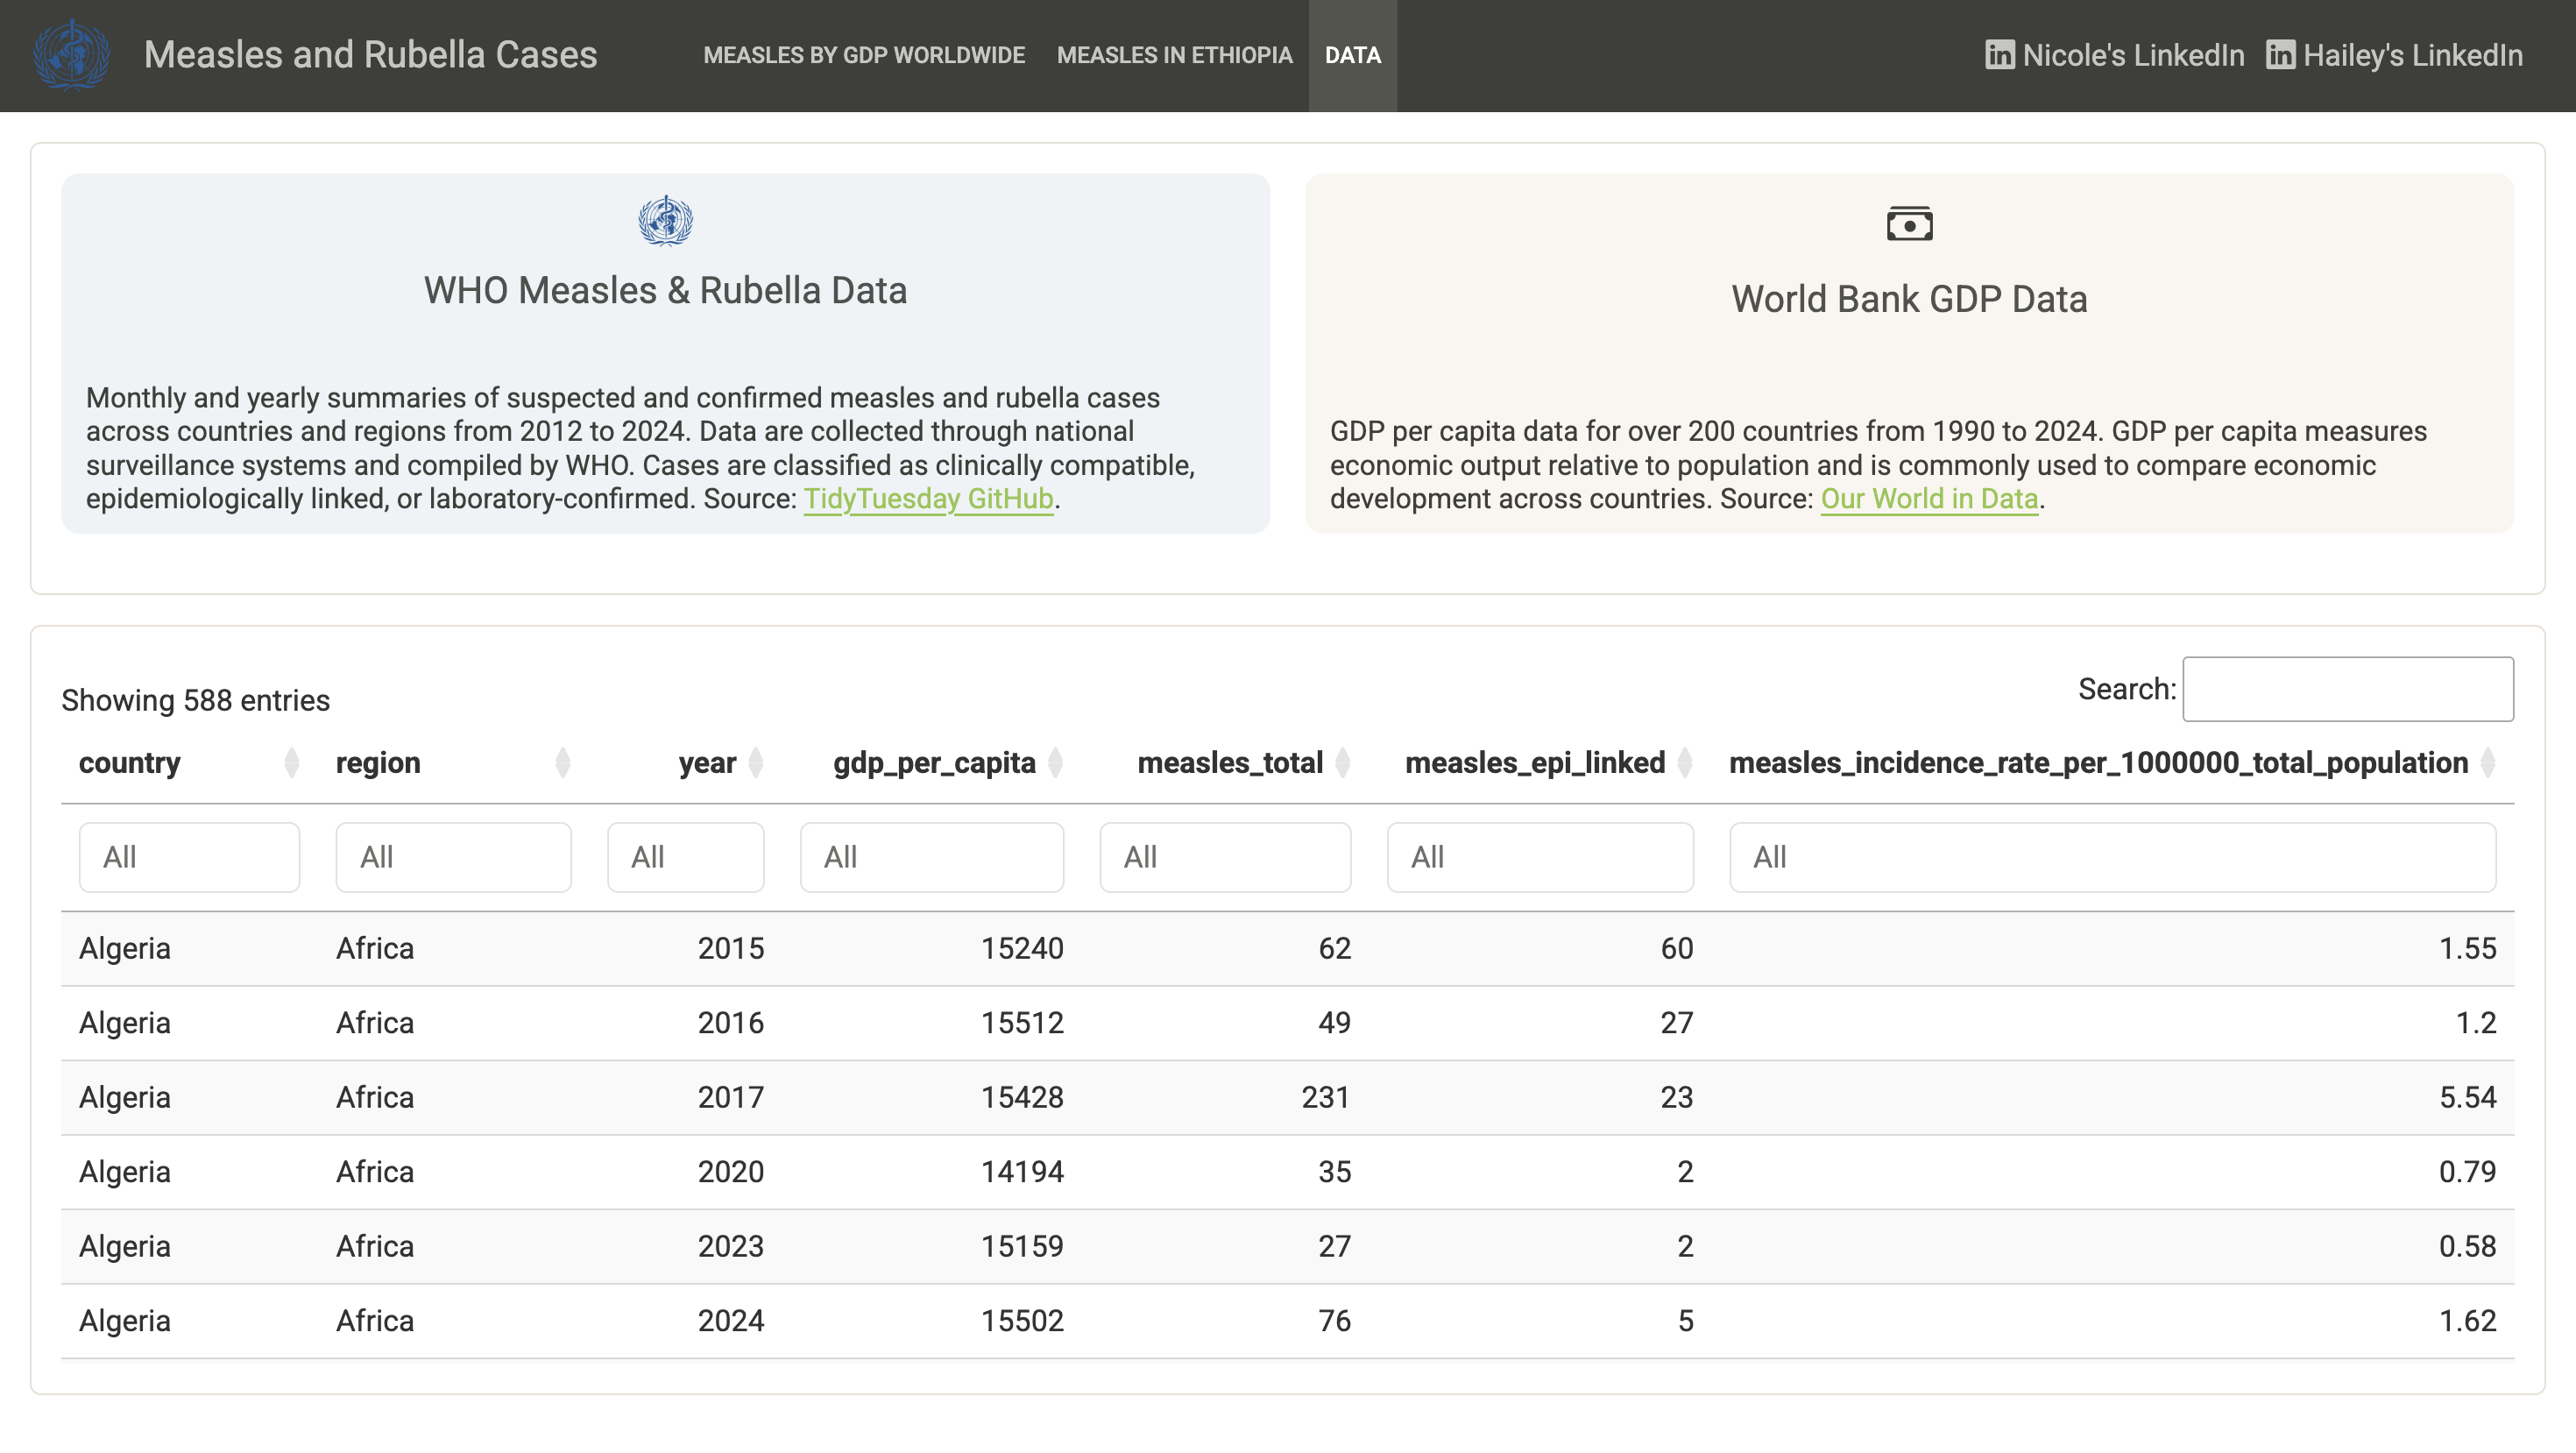
Measles & GDP Analysis Dashboard
Interactive global dashboard correlating measles incidence with GDP per capita using WHO and World Bank data. Leaflet maps, Plotly charts, and an Ethiopia case study.
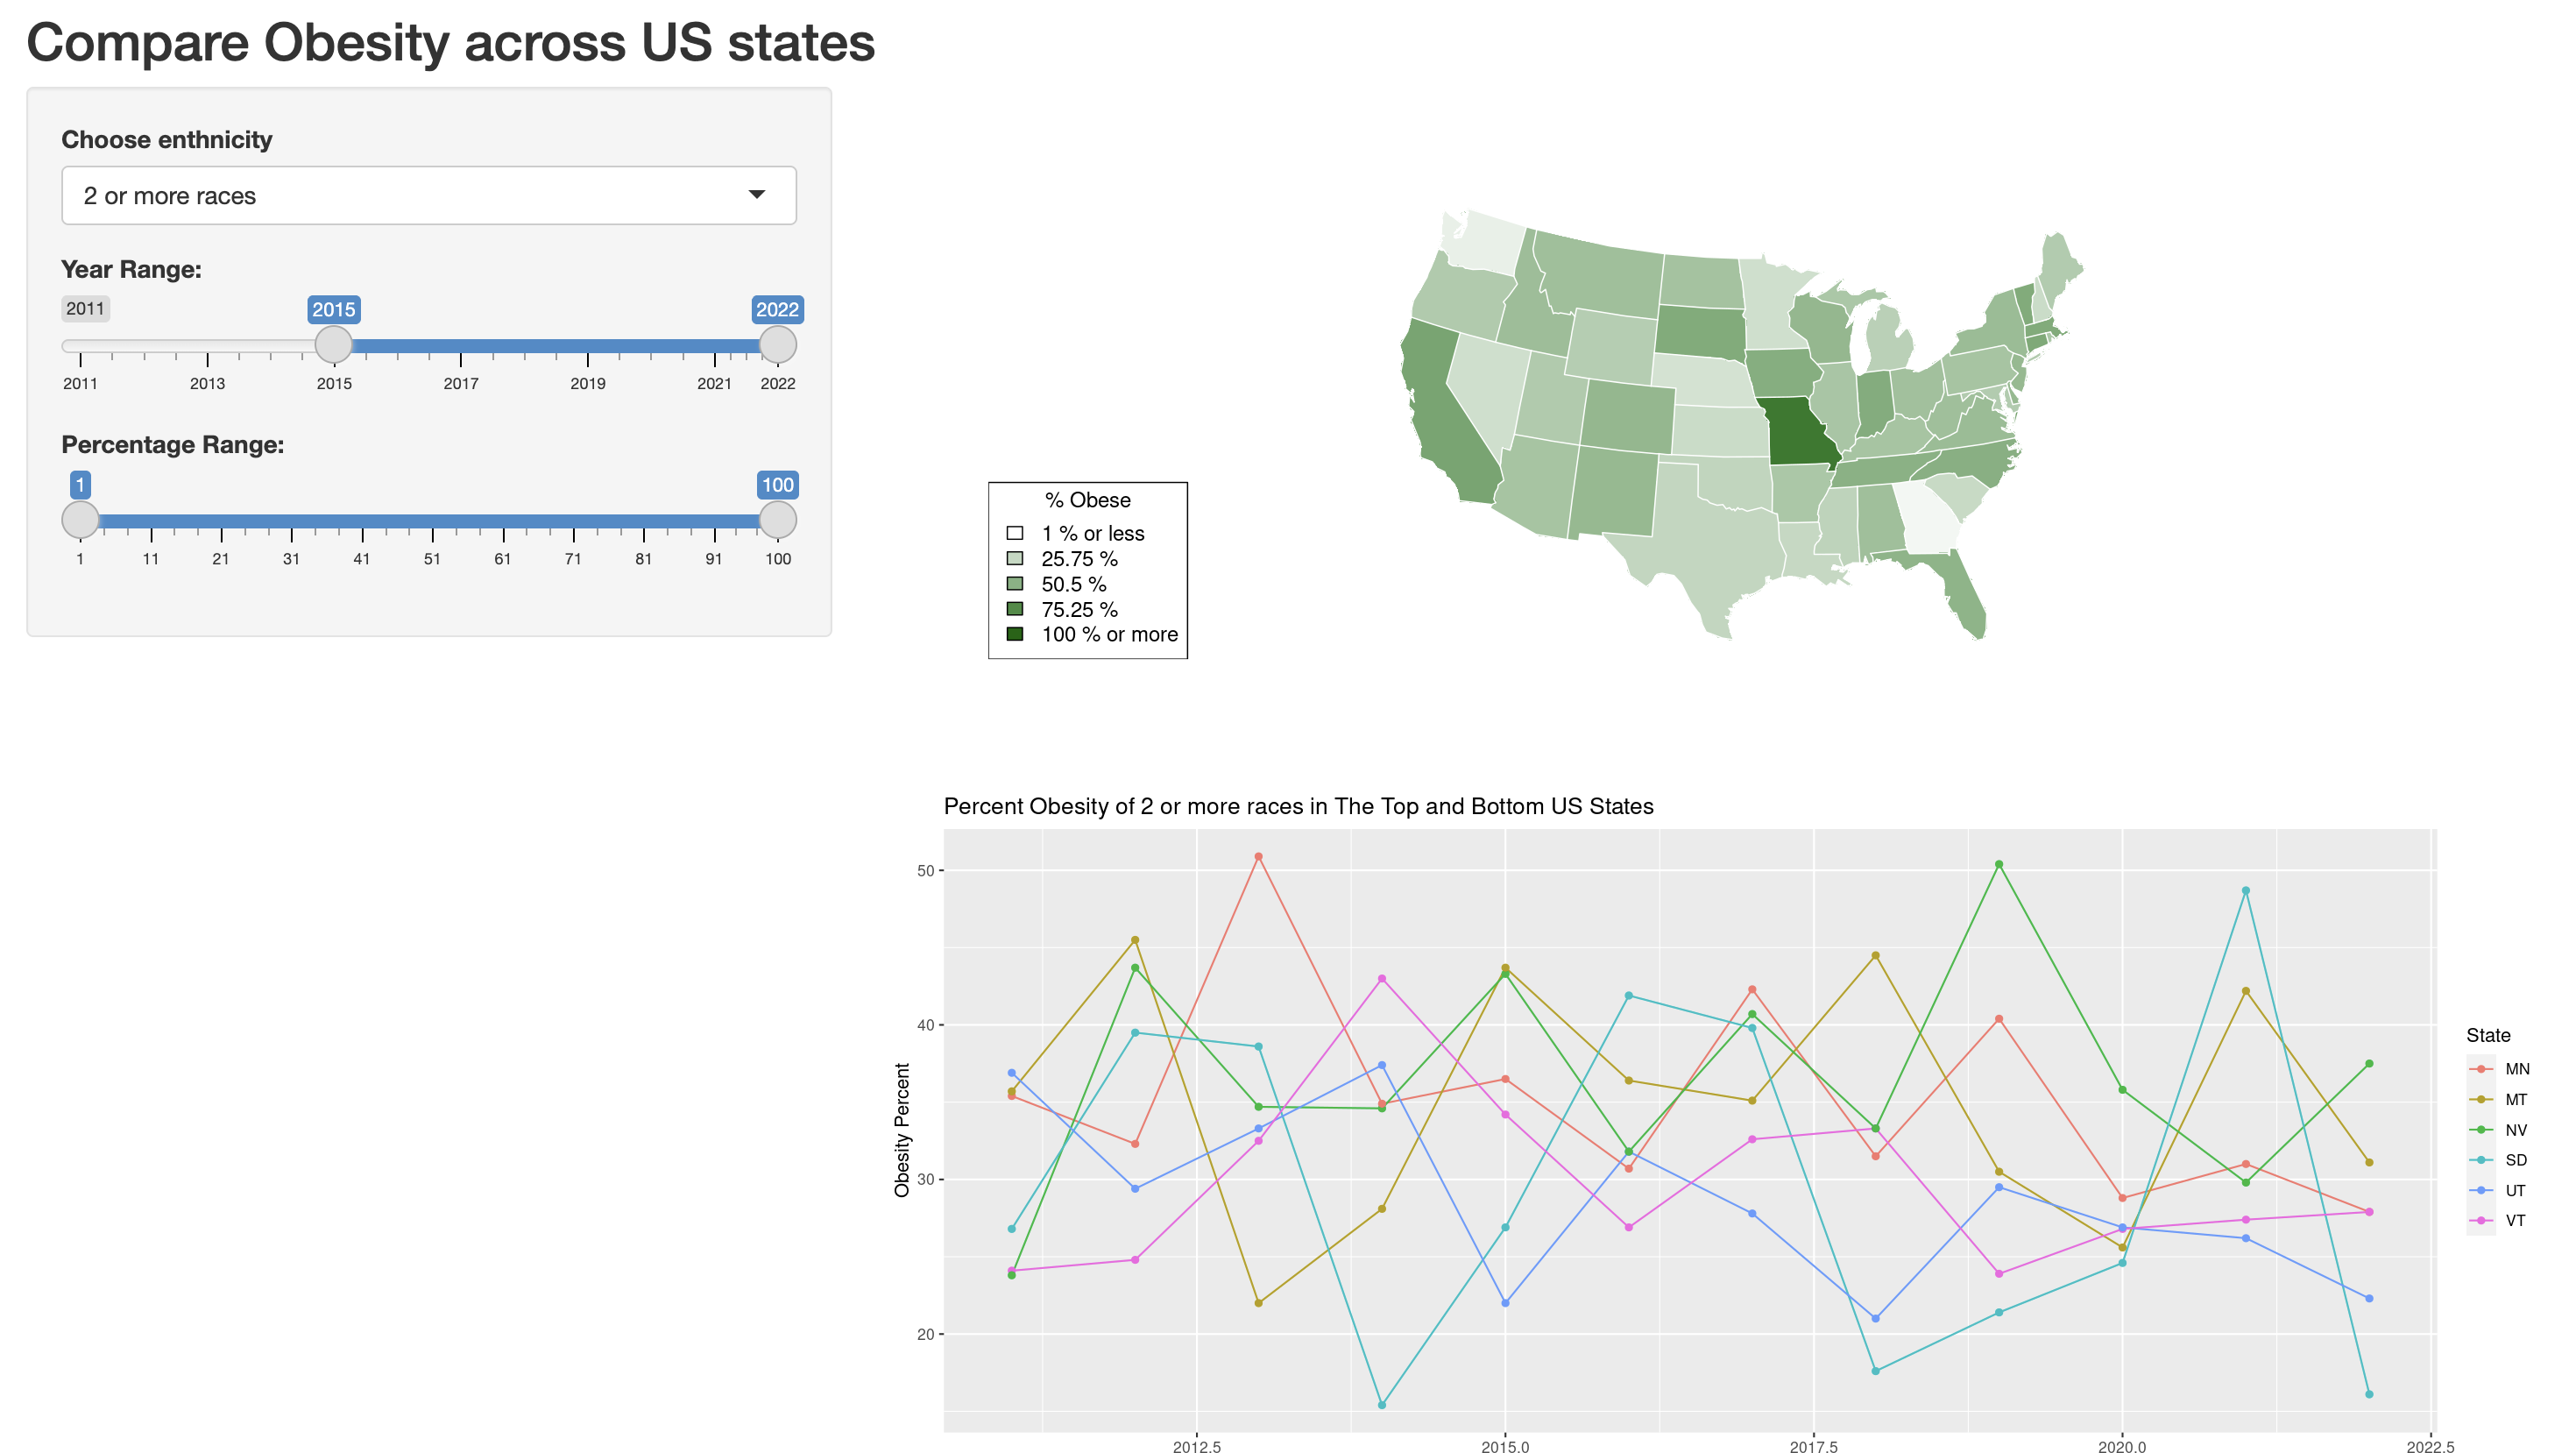
Shiny App: US Obesity Analysis
Reactive Shiny app exploring obesity rates across all 50 states, filterable by ethnicity, year range, and percentage interval. Features a choropleth US map and time-series for top and bottom states.
Coursework
Academic Projects
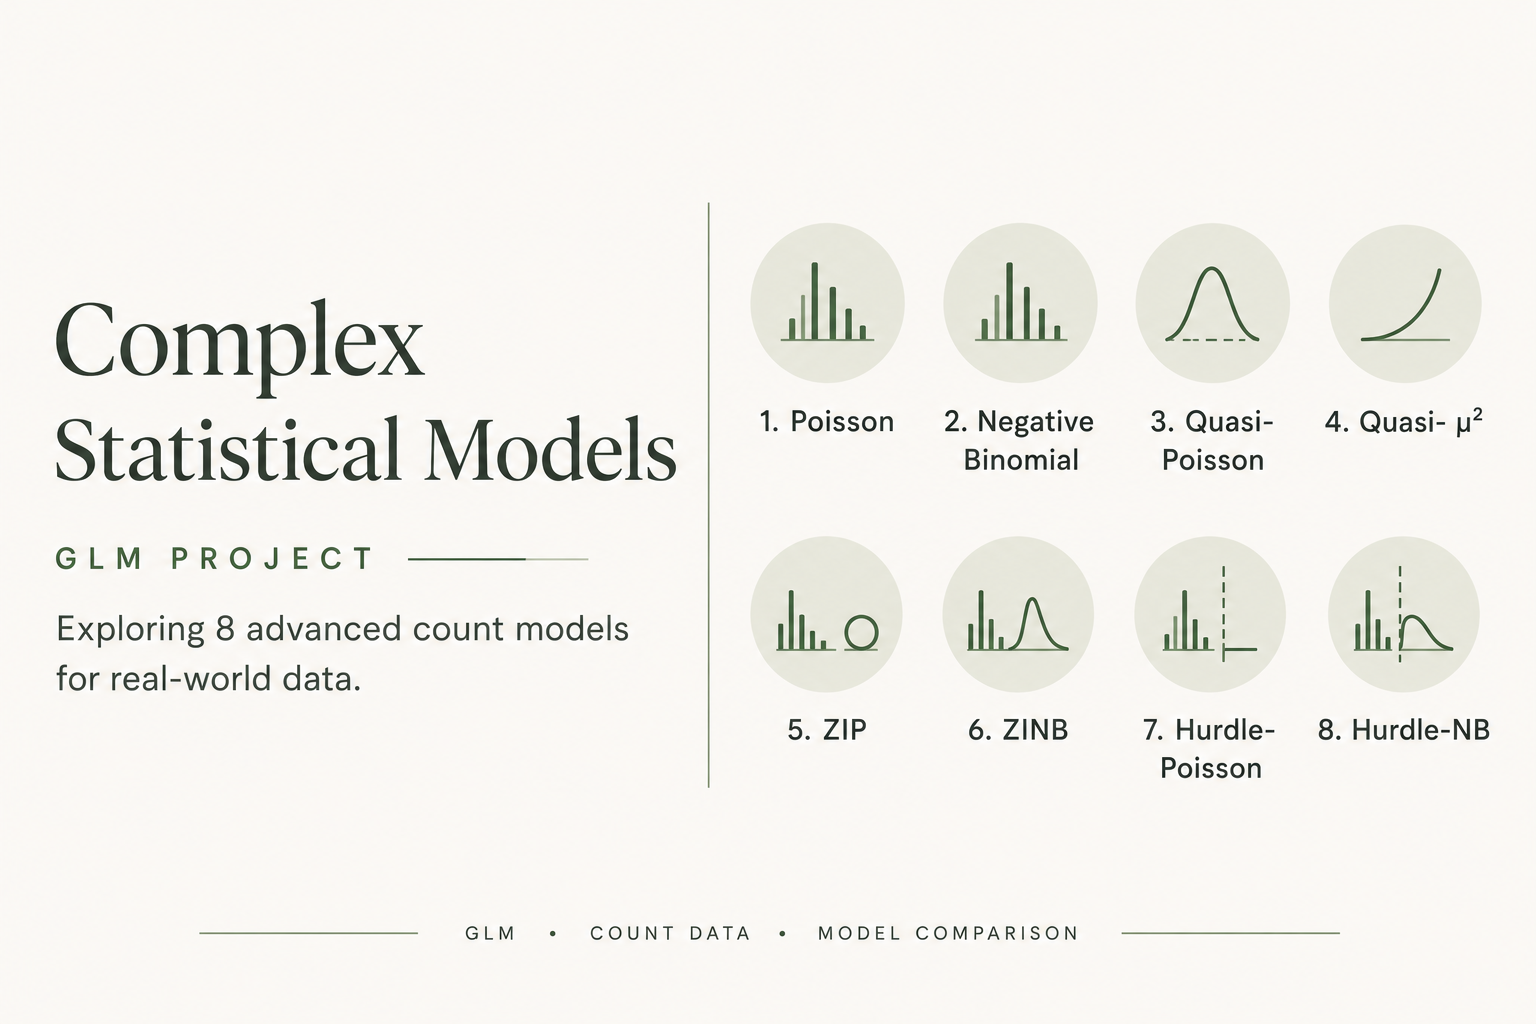
Complex Statistical Models: Elderly Falls
Rigorous GLM analysis comparing 8 count regression models on elderly falls data. Every decision documented across 47 log entries, culminating in a Negative Binomial model showing 84.7% fall reduction with exercise.
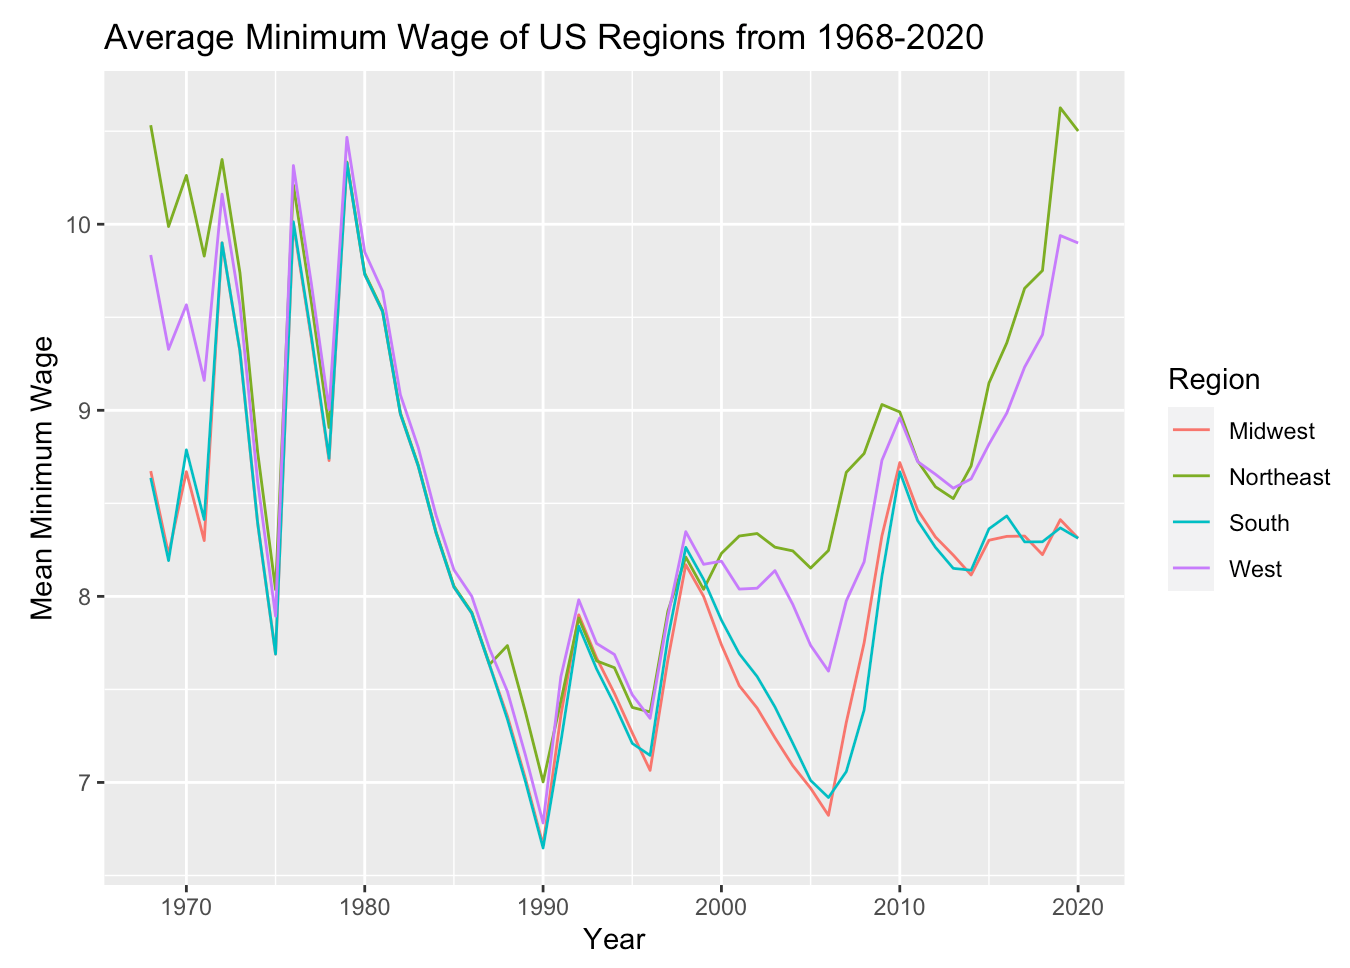
Exploratory Data Analysis
Two open-ended R analyses: US regional minimum wage trends from 1968–2020, and National Park trail exploration with functional programming and t-test inference.